
Search for an answer or browse help topics
Post Date : July 29, 2022
Technical charts help traders in taking informed decisions while placing trades in the market. They are a graphical representation of a stocks historical data like price, volume, and time intervals.
Various types of charts of technical analysis available in RMoney Active are:
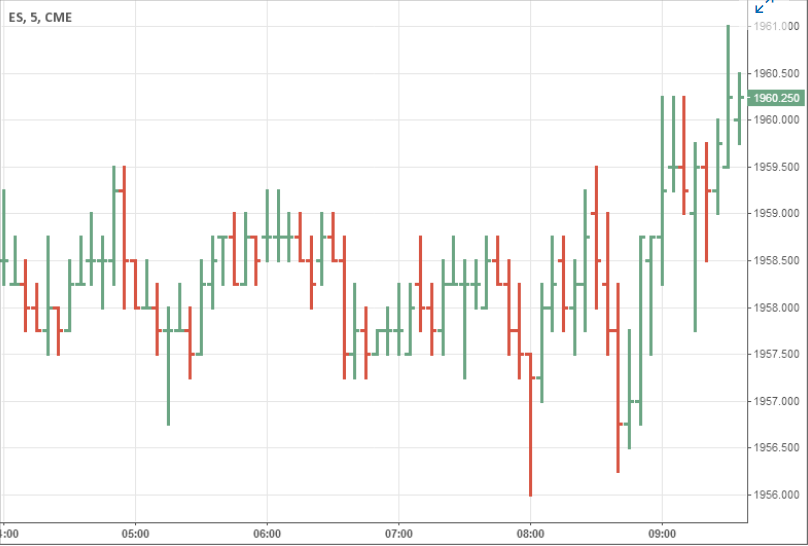
Bar charts happen to be one of the most basic tools of technical analysis. Also known as the OHCL or Open, High, Low, Close chart, bar charts embed the open, close, high, and low prices of stocks or other financial insturments in bars, plotted as a series of price over a specific time period. The height of each OHCL bar indicates the price range for the given period with high being the topmost point of the bar and the low being the lowermost point of bar.
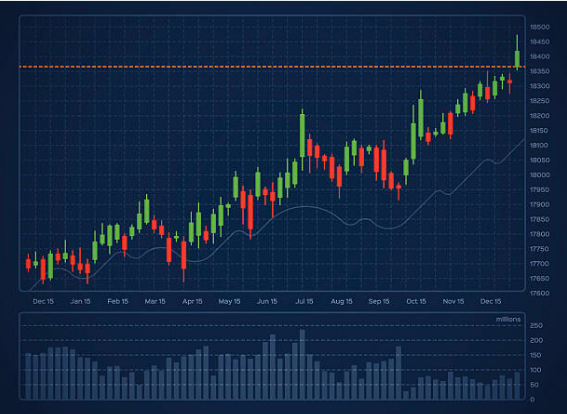
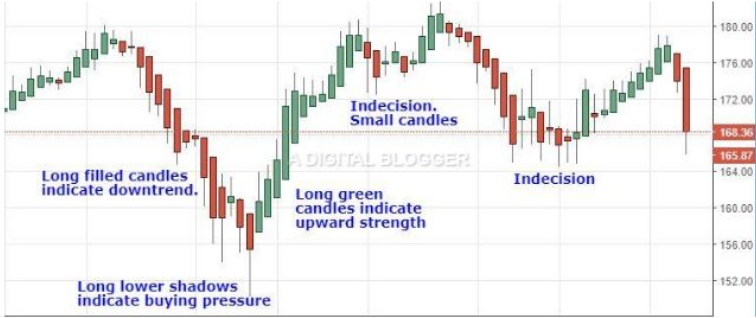
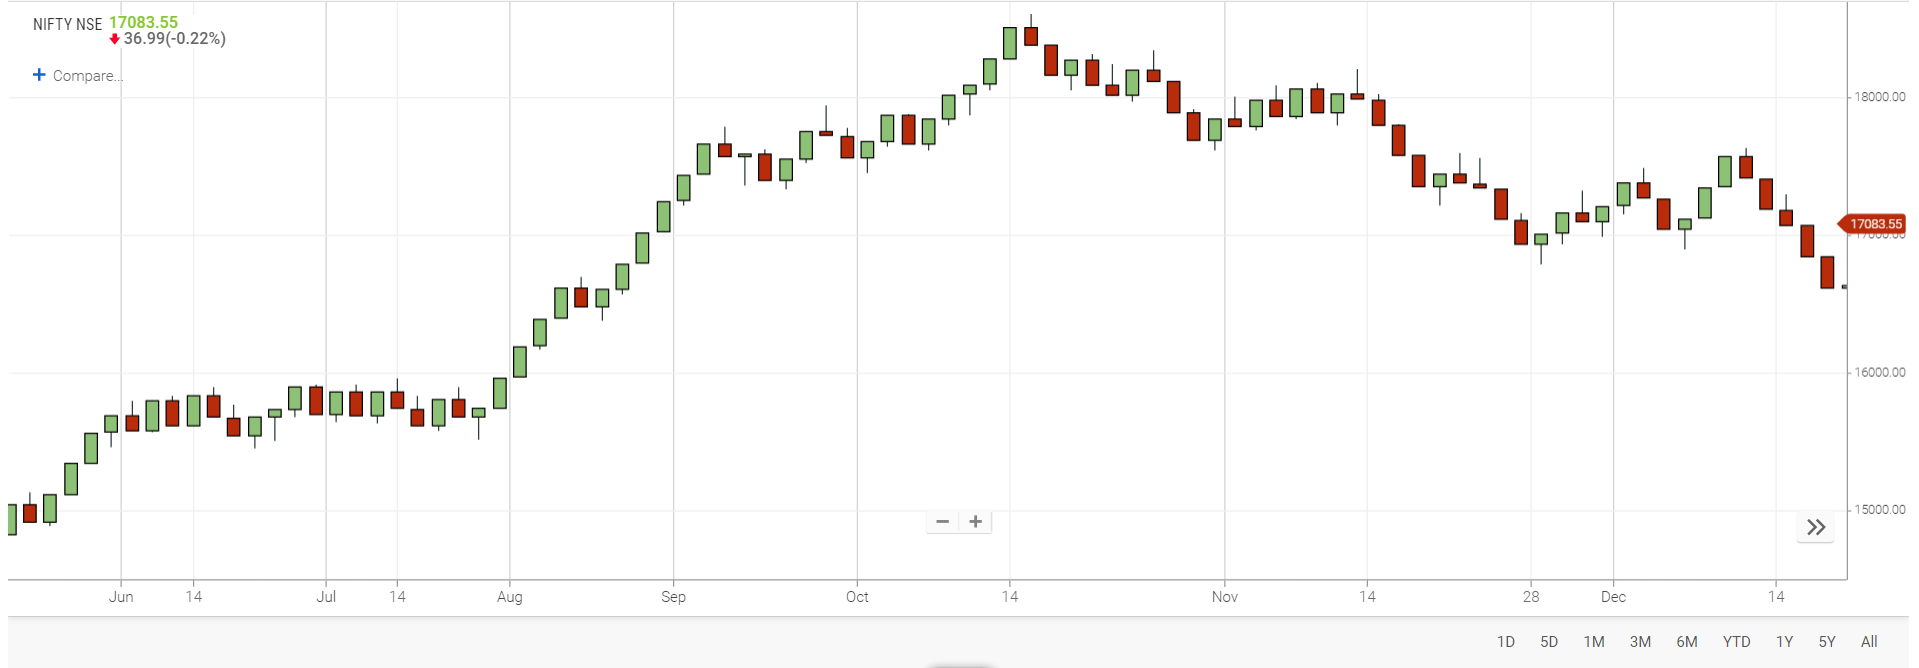
Candlestick charts in technical analysis are a visual representation of the size of price fluctuations. They are used to identify patterns and gauge the near-time direction of a security’s price. They are formed by grouping two or more candlesticks in a certain way. The thick part of the candlestick chart represents the range between the opening and the closing price. The long thin lines or the candle wicks represent the range of price movement from the bar.
As the name indicates, this chart merges volume into candlestick. This allows chartists and traders to analyze a stock’s both price action and volume with just a look at the price chart. They are similar to EquiVolume charts but are more informative as candlesticks are used instead of high-low boxes.
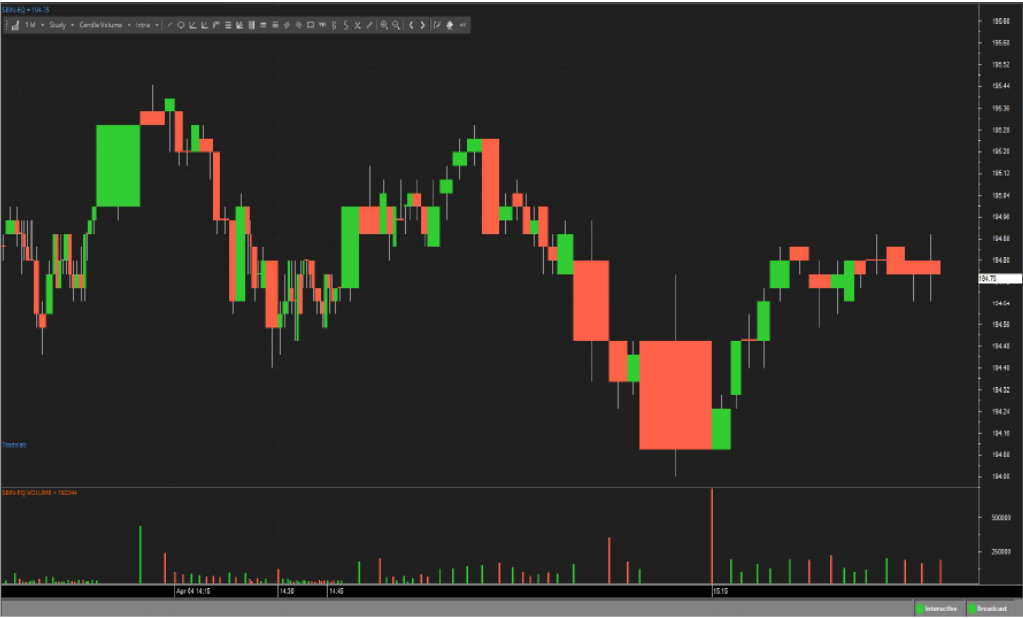
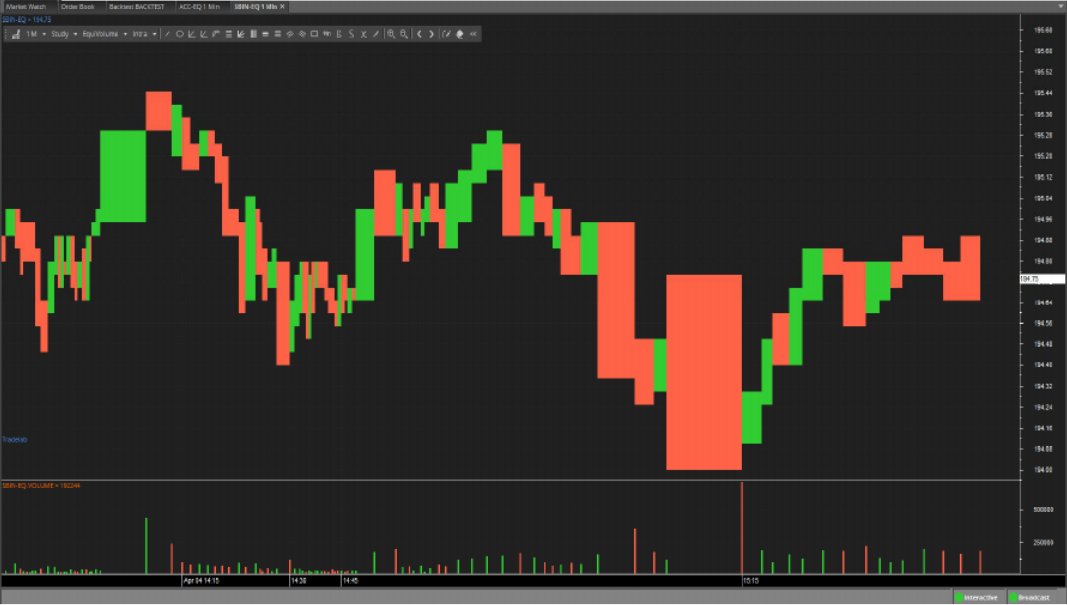
Equi Volume charts are price plots that combine price and volume of a security into a single chart and are represented by bars of different height and width. Volume plays an important role in confirming price movements. Equi Volume charts look similar to candlestick charts, but the candle ticks here are replaced with the Equi Volume boxes. With these charts it becomes easier to verify volume for reversals, big moves, support or resistance breaks, and climaxes.
An offshoot from the Japanese candlestick, Heikin means “average” and Ashi means “pace”. It can be used in conjunction with candlestick charts when trading securities to spot market trends and predict future prices. Heikin Ashi technique makes candlestick charts more readable and easier to analyze trends. The open, high, low, and close prices of HA candle ticks are not the actual prices but are the result of averaging values of the previous bar. This helps eliminate random volatility.
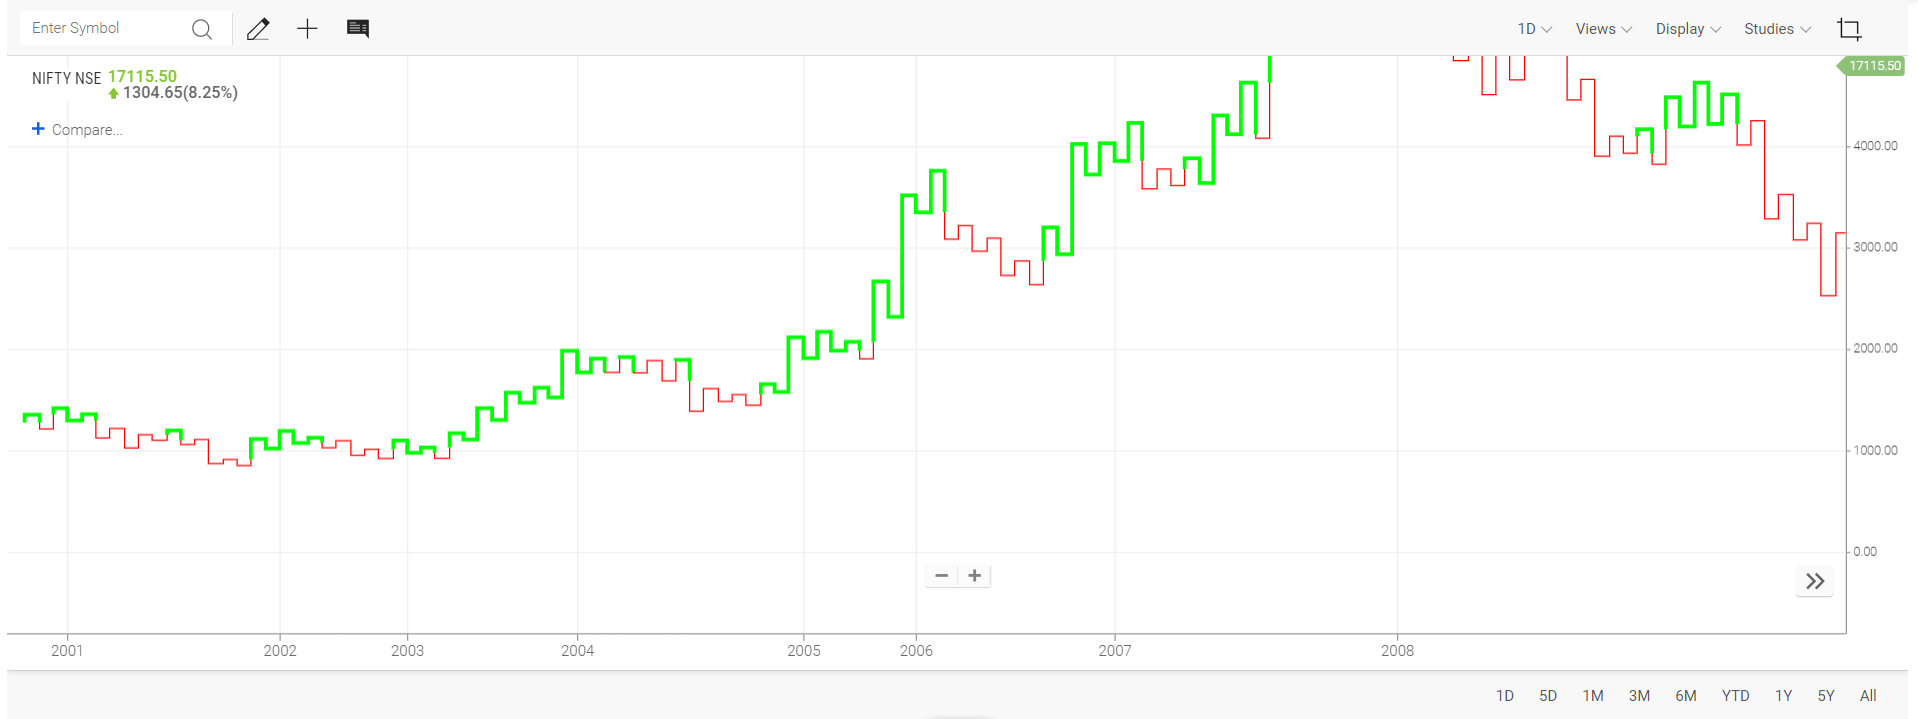
Kagi charts are used for tracking price movements and to make decisions on purchasing stocks. They are simple line charts that change direction when prices move by a reuired amount. It consists of a continuous line that changes directions and switches from thin to bold. The direction of the line changes when the price of the security changes beyond a predefined amount. Thick lines are drawn when the price of the underlying asset breaks above the previous high price and is interpreted as an increase in demand for the asset. Thin lines are used to represent increased supply when the price falls below the previous low.
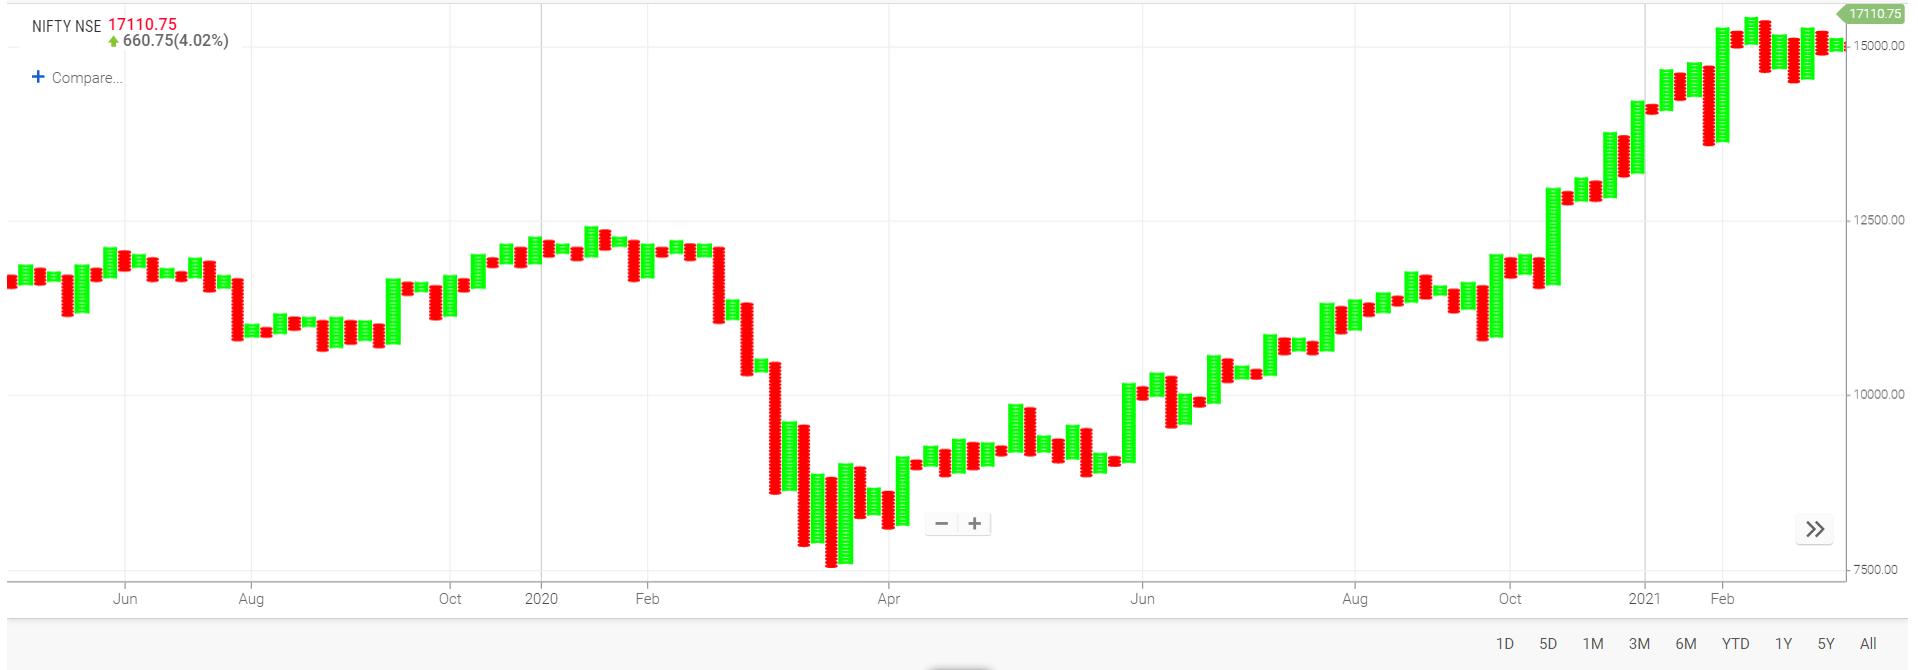
A point and figure chart plots price movements for stocks, bonds, commodities, or futures without taking into consideration the passage of time. It consists of columns of X’s and O’s that represent filtered price movements. X columns represent the rising prices and O columns represent the falling prices. They are used to utilize concepts such as support and resistance and other patterns when viewing P&F charts.
Renko charts ignore time and focus solely on price changes that meet a minimum requirement. Thus, they plot only price movements without taking time and volume into consideration. Instead of using X-Columns and O-Columns, Renko charts use price “bricks” that represent a fixed price move. Though time is not a factor it is a technique that should be used for swing or position trading rather than for intraday trading.
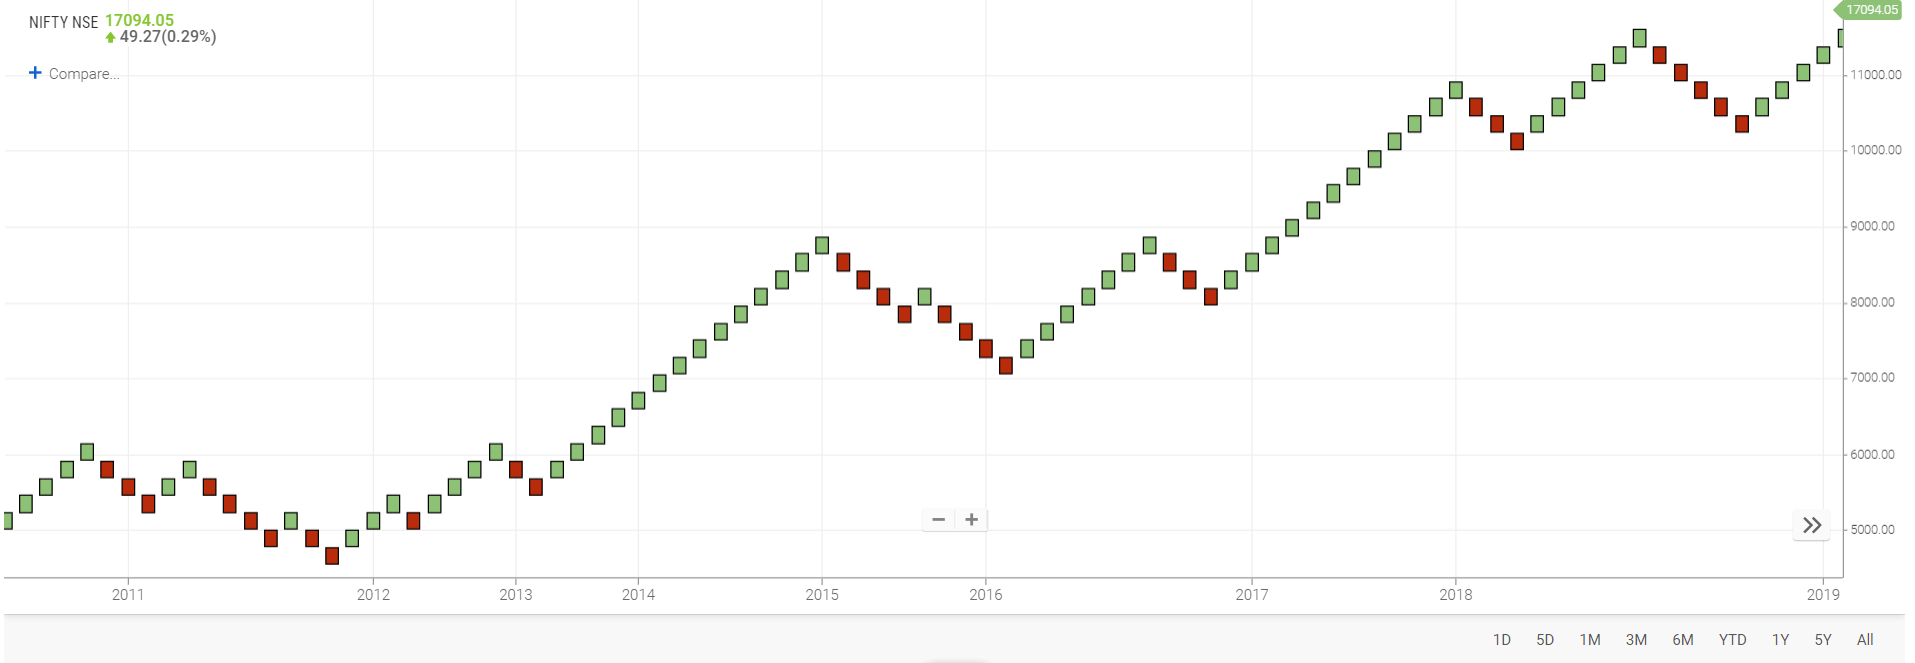
Range bar, as the name suggests, displays information as a range of data by plotting two Y-values, that are, low and high per data point. This type of chart is also sometime referred to as the floating bar chart since it looks like a set of bars “floating” above the horizontal axis.
To know about our offerings - Demat, Shares, Mutual Funds, IPOs, Insurance, Commodities and more…
Get started today to really enjoy your trading experience. Fill in your details, connect your bank account & upload your documents.

Ensure the security of your investments by updating your nominee details in your trading & demat account online. It’s quick and hassle-free!
📌 Act Now to Stay Compliant
For assistance, contact our Customer Care at 0562‑4266666 and email askus@rmoneyindia.com.

IT'S TIME TO HAVE SOME FUN!
Your family deserves this time more than we do.
Share happiness with your family today & come back soon. We will be right here.
Investment to ek bahana hai,
humein to khushiyon ko badhana hai.
E-mail
askus@rmoneyindia.com
Customer Care
+91-9568654321